
最通俗的前端监控方案
最通俗的前端监控方案
都说面试造飞机,现实打螺丝
不管如何,多学一点总是好。抱着好奇心态,我收集网上资料整理形成自己眼中的前端监控实现思路,当然这个还是很简陋
不过我想复杂监控系统框架,核心也是通过这些 api 收集完成,只是更加系统全面化
理清思路
所谓的监控,我这里大致分为 4 步,分别是定义监控范围,上报数据,分析数据,解决系统问题
1、定义监控范围
定义好基础数据标准,便于后续分析
- 错误类数据结构
| 参数名 | 类型 | 必填 | 说明 |
|---|---|---|---|
| type | string | 是 | 错误类型,如'js'、'resource'、'custom'、'performance' |
| subType | string | 是 | 错误子类型,如'onerror'、'promise'、'xhr'、'business' |
| msg | string | 是 | 错误信息 |
| userAgent | string | 是 | 用户设备信息 |
| url | string | 否 | 错误发生的当前对象,资源 url,请求 url,页面 url |
| stack | string | 否 | 错误堆栈信息 |
| time | number | 是 | 错误发生的时间戳 |
| lineNo | number | 否 | 发生错误的代码行号 |
| columnNo | number | 否 | 发生错误的代码列号 |
| businessData | object | 否 | 自定义业务数据 |
| performanceData | object | 否 | 性能相关数据 |
| appId | string | 是 | 应用 ID,用于区分不同应用 |
| userId | string | 否 | 用户 ID,用于区分不同用户 |
| page | string | 否 | 当前页面 url |
- 错误主类型和子类型对应关系(这里可以自己指定规则和类型)
const validSubTypes = {
js: ["onerror", "promise", "xhr", "fetch"],
resource: ["img", "script", "link", "audio", "video"],
custom: ["business"],
performance: ["component_render"],

};
js 和 resource 类型错误,会自动上报,其他类型错误,需要手动上报;比如:页面上订单创建失败,你可以上报一个
custom + business的业务错误;首页加载速度超过 5s,你可以上报一个performance + component_render的性能错误
- 请求类数据结构
| 参数名 | 类型 | 必填 | 说明 |
|---|---|---|---|
| type | string | 是 | 请求类型,如'xhr'、'fetch'、'vuex_action' |
| url | string | 是 | 请求 URL |
| method | string | 是 | 请求方法,如'GET'、'POST' |
| duration | number | 是 | 请求耗时,单位毫秒 |
| status | number | 是 | HTTP 状态码 |
| success | boolean | 是 | 请求是否成功 |
| time | number | 是 | 请求发生的时间戳 |
| payload | object | 否 | 请求负载数据 |
| appId | string | 是 | 应用 ID,用于区分不同应用 |
| userId | string | 否 | 用户 ID,用于区分不同用户 |
| page | string | 否 | 当前页面 url |
- 页面类数据机构
| 参数名 | 类型 | 必填 | 说明 |
|---|---|---|---|
| appId | string | 是 | 应用 ID,用于区分不同应用 |
| userId | string | 否 | 用户 ID,用于区分不同用户 |
| title | string | 是 | 页面 标题 |
| url | string | 是 | 页面 URL |
| referrer | string | 是 | 页面来源 URL |
| screenWidth | string | 是 | 可视区域宽度 |
| screenHeight | string | 是 | 可视区域高度 |
| language | string | 是 | 页面语言版本 |
| userAgent | string | 是 | 用户设备信息 |
| time | number | 是 | 上报发生的时间戳 |
| dnsTime | number | 是 | dns 解析时间 |
| tcpTime | number | 是 | tcp 连接时间 |
| sslTime | number | 是 | ssl 握手时间 |
| requestTime | number | 是 | 请求时间 |
| responseTime | number | 是 | 响应时间 |
| domReadyTime | number | 是 | dom 解析 |
| loadTime | number | 是 | 页面完全加载时间 |
2、上报数据
前端错误大致分为:js 运行错误,资源加载错误,请求接口错误
请求数据
页面相关数据
1、如何收集 js 运行错误
这里是通过 window.onerror 监听全局错误来实现的
收集到关键的几个信息,如下代码里解释
// 监听全局错误
window.onerror = (msg, url, lineNo, columnNo, error) => {
this.captureError({
type: "js",
subType: "onerror",

    msg, // 错误信息

    url, // 报错的文件地址

    lineNo, // 错误行号

    columnNo, // 错误列号
stack: error?.stack || "", // 错误堆栈信息
time: new Date().getTime(),

  });
return true; // 阻止默认行为

};
因为
onerror无法收集到promise报的错误,这里特殊化处理下
// 监听Promise错误
this.unhandledRejectionListener = (event) => {
this.captureError({
type: "js",
subType: "promise",
msg: event.reason?.message || "Promise Error",
stack: event.reason?.stack || "",
time: new Date().getTime(),

  });

};
window.addEventListener("unhandledrejection", this.unhandledRejectionListener);
// ps:记得页面组件销毁时,注销掉当前的事件监听
2、如何收集资源加载错误
这里是通过
window.addEventListener('error', ...)监听资源加载错误来实现的不过需要过滤掉上面已经监听的 js 错误,避免重复上报
// 监听资源加载错误
this.resourceErrorListener = (event) => {
// 过滤JS错误,因为JS错误已经被window.onerror捕获
if (event.target !== window) {
this.captureError({
type: "resource",
subType: event.target.tagName.toLowerCase(),
url: event.target.src || event.target.href || "",
msg: `资源加载失败: ${event.target.tagName}`,
time: new Date().getTime(),

    });

  }

};
window.addEventListener("error", this.resourceErrorListener, true); // 使用捕获模式
3、如何收集请求异常错误和请求基础数据
通过监听
AJAX请求,监听Fetch请求,收集错误。具体错误包含:请求自身错误事件,请求超时事件,非成功状态码的请求,以及成功状态码请求(用于后续性能分析)
- 监听
AJAX请求
  /**

   * 监控XMLHttpRequest请求

   */
monitorXHR() {
const originalXHR = window.XMLHttpRequest;
const _this = this;

window.XMLHttpRequest = function () {
const xhr = new originalXHR();
const originalOpen = xhr.open;
const originalSend = xhr.send;

// 记录请求开始时间
let startTime;
let reqUrl;
let reqMethod;


      xhr.open = function (method, url, ...args) {

        reqUrl = url;

        reqMethod = method;
return originalOpen.apply(this, [method, url, ...args]);

      };


      xhr.send = function (data) {

        startTime = new Date().getTime();

// 添加错误事件监听

        xhr.addEventListener("error", function () {
const duration = new Date().getTime() - startTime;

// 记录请求信息

          _this.captureRequest({
type: "xhr",

            url: reqUrl,

            method: reqMethod || "GET",

            duration,

            status: 0,

            success: false,

            time: new Date().getTime(),

          });

// 记录错误信息

          _this.captureError({
type: "js",

            subType: "xhr",

            msg: `XHR请求错误: ${reqUrl}`,

            url: reqUrl,

            stack: "",

            time: new Date().getTime(),

          });

        });

// 添加超时事件监听

        xhr.addEventListener("timeout", function () {
const duration = new Date().getTime() - startTime;

// 记录请求信息

          _this.captureRequest({
type: "xhr",

            url: reqUrl,

            method: reqMethod || "GET",

            duration,

            status: 0,

            success: false,

            time: new Date().getTime(),

          });

// 记录错误信息

          _this.captureError({
type: "js",

            subType: "xhr",

            msg: `XHR请求超时: ${reqUrl}`,

            url: reqUrl,

            stack: "",

            time: new Date().getTime(),

          });

        });


        xhr.addEventListener("loadend", function () {
const duration = new Date().getTime() - startTime;
const status = xhr.status;
const success = status >= 200 && status < 300;


          _this.captureRequest({
type: "xhr",

            url: reqUrl,

            method: reqMethod || "GET",

            duration,

            status,

            success,

            time: new Date().getTime(),

          });

// 对于HTTP错误状态码,也捕获为错误
if (!success) {

            _this.captureError({
type: "js",

              subType: "xhr",

              msg: `XHR请求失败: 状态码 ${status}`,

              url: reqUrl,

              stack: "",

              time: new Date().getTime(),

            });

          }

        });

return originalSend.apply(this, arguments);

      };

return xhr;

    };

  }
- 监听
Fetch请求
  /**

   * 监控Fetch请求

   */
monitorFetch() {
const originalFetch = window.fetch;
const _this = this;

window.fetch = function (input, init) {
const startTime = new Date().getTime();
const url = typeof input === "string" ? input : input.url;
const method = init?.method || (input instanceof Request ? input.method : "GET");

return originalFetch

        .apply(this, arguments)

        .then((response) => {
const duration = new Date().getTime() - startTime;
const status = response.status;
const success = response.ok;


          _this.captureRequest({
type: "fetch",

            url,

            method,

            duration,

            status,

            success,

            time: new Date().getTime(),

          });

return response;

        })

        .catch((error) => {
const duration = new Date().getTime() - startTime;


          _this.captureRequest({
type: "fetch",

            url,

            method,

            duration,

            status: 0,

            success: false,

            time: new Date().getTime(),

          });

// 记录错误信息

          _this.captureError({
type: "js",

            subType: "fetch",

            msg: error.message || "Fetch Error",

            url,

            stack: error.stack || "",

            time: new Date().getTime(),

          });

throw error;

        });

    };

  }
4. 上报页面数据
案例中,使用是 vue 框架,页面上报方法,是放到路由守卫中进行调用
  reportPage(info = {}) {
const pageInfo = { ... }
if (window.performance) {
const performanceInfo = {}
Object.assign(pageInfo, performanceInfo);

    }
// 发送页面信息
this.send("/api/pages/create", pageInfo);

  }

// vue 部分代码

  router.afterEach((to, from) => {
// 获取全局monitor实例
const monitor = appInstance.config.globalProperties.$monitor;

if (monitor) {
// 手动上报页面访问

      monitor.reportPage();

    }

  });
传统的页面,可以在
window.onload中进行上报
5. 上报时机
- 定时批量上报:增加一个队列,放置 js 错误数据,请求数据。页面的数据因为不是很多,采用立即上报;
- 传统的 ajax\fench 请求,页面卸载请求会丢失。这里采用
navigator.sendBeacon发送,如果浏览器不支持,则采用图片请求的方式发送数据。
/**

 * 发送数据到服务器

 * @param {string} path API路径

 * @param {Object} data 数据

 */
send(path, data) {
// 如果没有baseURL则不发送
if (!this.baseURL) return;

// 使用Beacon API发送,避免页面卸载时丢失数据
if (navigator.sendBeacon) {
const fullURL = this.baseURL + path;
const blob = new Blob([JSON.stringify(data)], { type: "application/json" });

    navigator.sendBeacon(fullURL, blob);
return;

  }

// 后备方案:使用图片请求
const img = new Image();

  img.src = `${this.baseURL}${path}?data=${encodeURIComponent(JSON.stringify(data))}&t=${new Date().getTime()}`;

}
3、分析数据
这是整个方案中比较难的部分,如何运用基础数据来分析出有价值的东西。以下是我思考几个方向
js 错误分析
- 内置一些常见 js 错误分类标准,根据错误信息匹配得出错误原因
语法错误(SyntaxError):


原因:代码书写不符合 JavaScript 语法规则。


示例:let x = "123"; 缺少分号。


解决方法:检查并修正代码中的语法错误,例如确保所有语句都正确结束,括号和引号正确匹配等。


类型错误(TypeError):


原因:变量或参数不是预期的类型,或者尝试对未定义或 null 的值进行操作。
2. 接入大模型,提供文件内容和报错信息,让 ai 给出分析原因
请求分析
- 请求时间超过 1s 请求有哪些
- 每个页面有多少个请求
- 重复请求有哪些
- 请求异常有哪些
页面分析
- 首屏加载时间
- 哪个页面加载时间最长
- 哪个用户访问了哪些页面
- pv/uv
4、解决系统问题
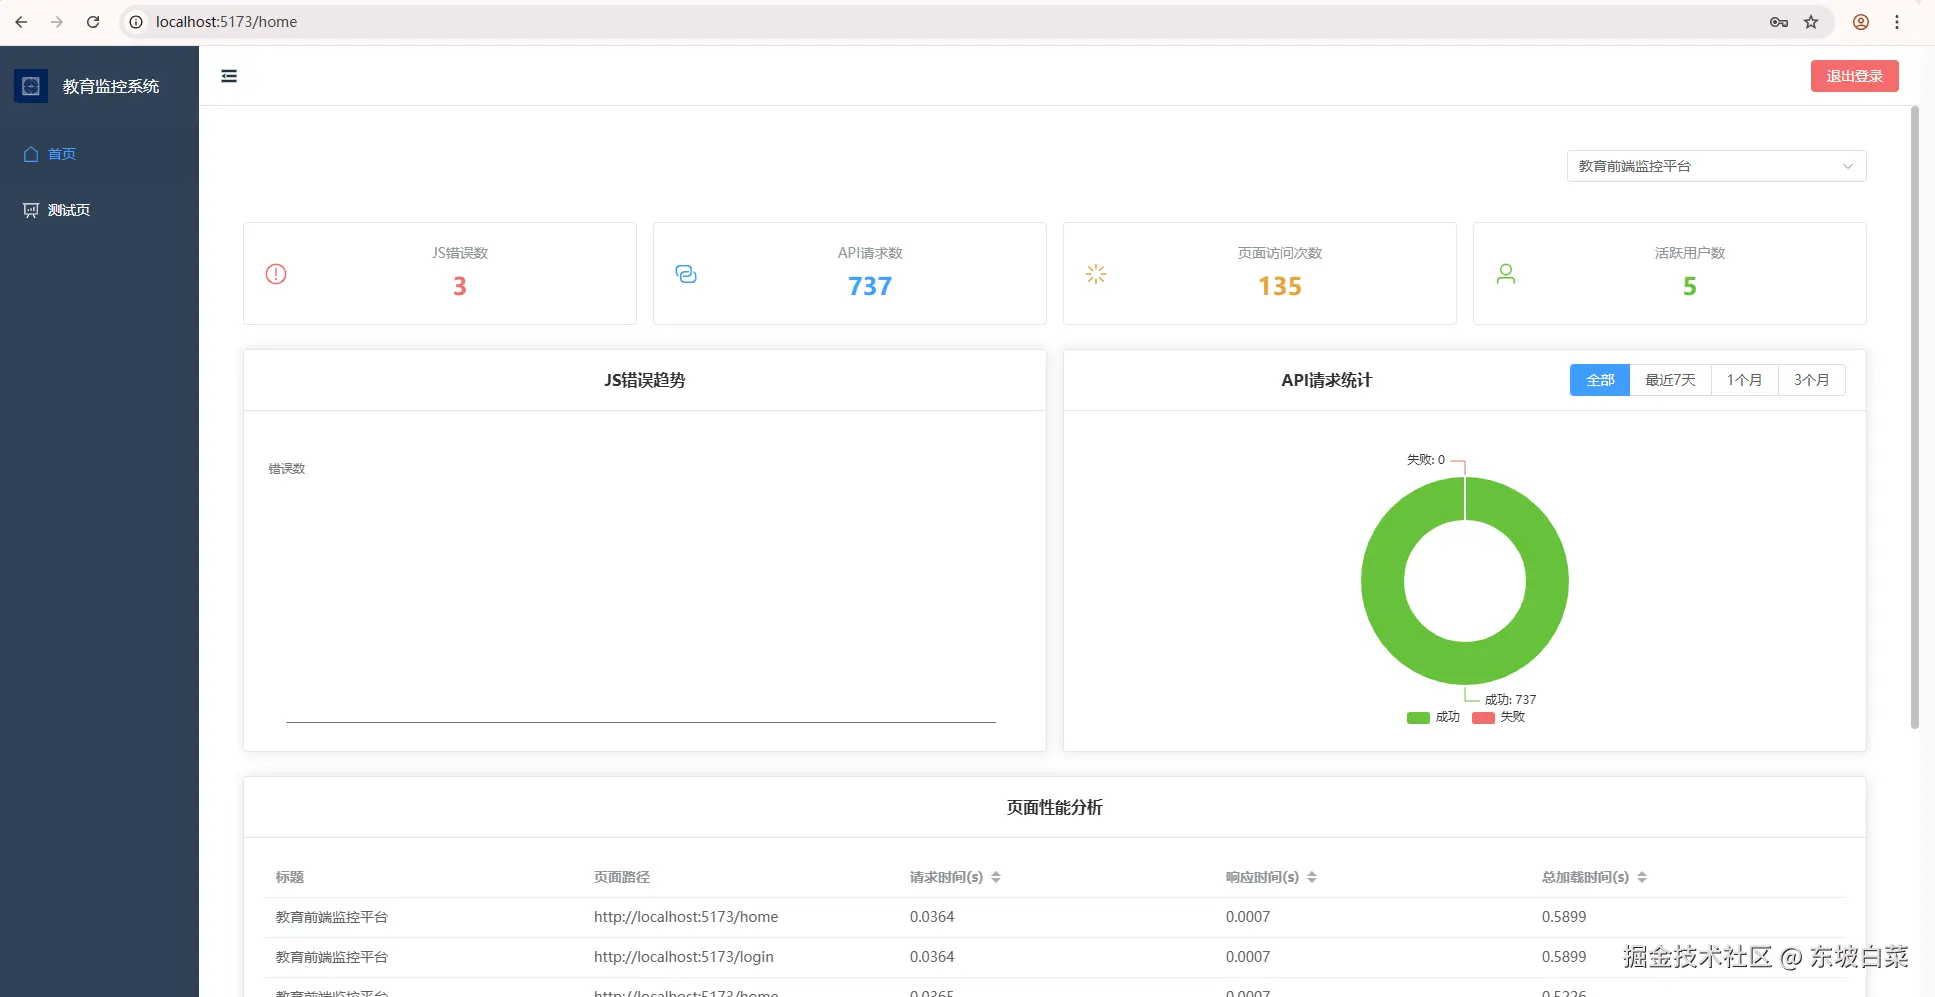
图表可视化展示 每天早上 9 点统计,当前存在的问题错误,短信,邮件,电话告警开发人员 灰度版本上线后,监控 24 小时,错误数量,页面性能情况,超过一定值,自动清除灰度版本测试的用户信息 给错误打上分类标签,增加错误状态【待处理】、以及错误分析指导意见。开发人员通过指导意见快速解决问题,修改错误状态为【已完成】
5、总结
有点惭愧,本人目前待过的公司,还没有实际的前端监控项目落地。对于具体如何使用,解决现实中问题,也欢迎大家给出分享案例。
这里更多是给大家一个抛砖引玉的作用。像成熟的页面性能分析产品:百度统计 网上提到成熟前端监控产品:sentry,目前还没有来得急学习,后续有时间写一篇入门学习指南
文章中案例代码:gitee.com/banmaxiaoba…
来源:juejin.cn/post/7519074019620159523
